The evolution of Heatmaps
The context:
Heatmaps are one of Hotjar’s most distinct product offerings on the market. They allow teams to visualize user behavior, uncover patterns, and identify opportunities to improve any web page.
I led content design for Heatmaps for over a year, and then, when Contentsquare aquired Hotjar, I was part of the team that introduced Hotjar’s Heatmaps to Contentsquare’s Zoning feature.
The team:
Hotjar: Product manager, Product designer, Content designer (me), Engineering, Product marketing
Contentsquare: Product manager, Product designer, Content designer (me)
Phase 1 (Hotjar): Introducing Engagement zones and Rage click heatmaps
The two new heatmap types help teams monitor where users engage the most on a page (Engagement zones), and identify elements that trigger frustration (Rage clicks).

The Engagement zones heatmap was one of the first major projects I contributed to after joining the squad. The team had already conducted discovery research and identified on-page engagement as one of three key customer needs.
This new heatmap type, available on select paid plans, was designed to make it easier to identify how users engage with specific areas of a page. It also simplifies the experience for customers by taking away the manual load of swapping between Click, Move, and Scroll maps (already existing map types) in order to achieve the same outcome.
Engagement zones heatmap
The process:
I led the naming strategy for this new heatmap type and collaborated with the Marketing team to decide on the final terminology. We also tested naming options during usability sessions for the feature.
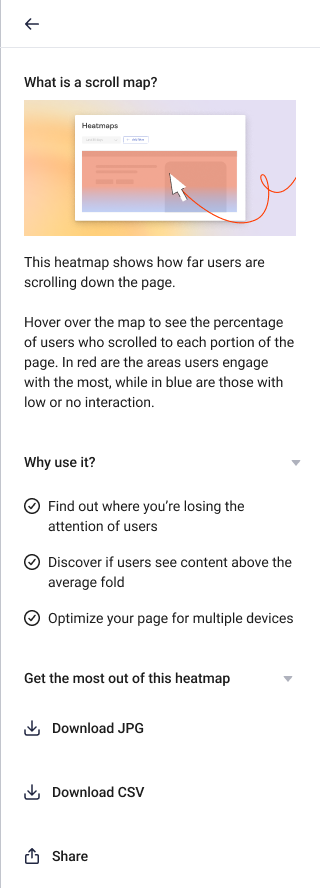
In parallel, I proposed adding an explanation to clarify what Engagements zones represent and how they can be used. The Product designer and I brainstormed some ideas and landed on a tooltip that opened a section within the existing heatmap side panel. This gave users quick access to educational content explaining the map’s value, along with a prompt to download or share it.

The result:
17% of users who viewed the education content within the side panel went on to download or share the heatmap which was a big win for the team.
We extended the education content to the other heatmap types as well. This, along with other improvements we made to the side panel, contributed to an increase in Heatmaps monthly active users by 15% from 55K to 63K.
The adoption of Engagement zones reached 13% within the first month, exceeding our adoption goal of 10%.


Phase 2 (Hotjar): A customized Heatmaps journey
Guiding customers to the right heatmap for their use case
This project aimed to help customers generate more accurate heatmaps—better aligned with their analytics goals and supported by higher-quality screenshots.
The process:
In collaboration with the Product Designer, I began by mapping each heatmap type to specific user goals identified in past research. We then added a new step to the creation flow that guided users to the most relevant map based on their objectives.
From a content perspective, it was important that each step in the flow felt like a natural conversation with the user—offering guidance in a simple, non-intrusive way. For example, we asked, “What do you want to find out?” to prompt goal selection. Simple, and to the point. This question-based approach continued throughout the flow, making the experience more intuitive and user-centered.
As part of the redesign, we tackled a common user pain point: poor screenshot quality and accuracy—a critical issue since heatmaps rely on these images.
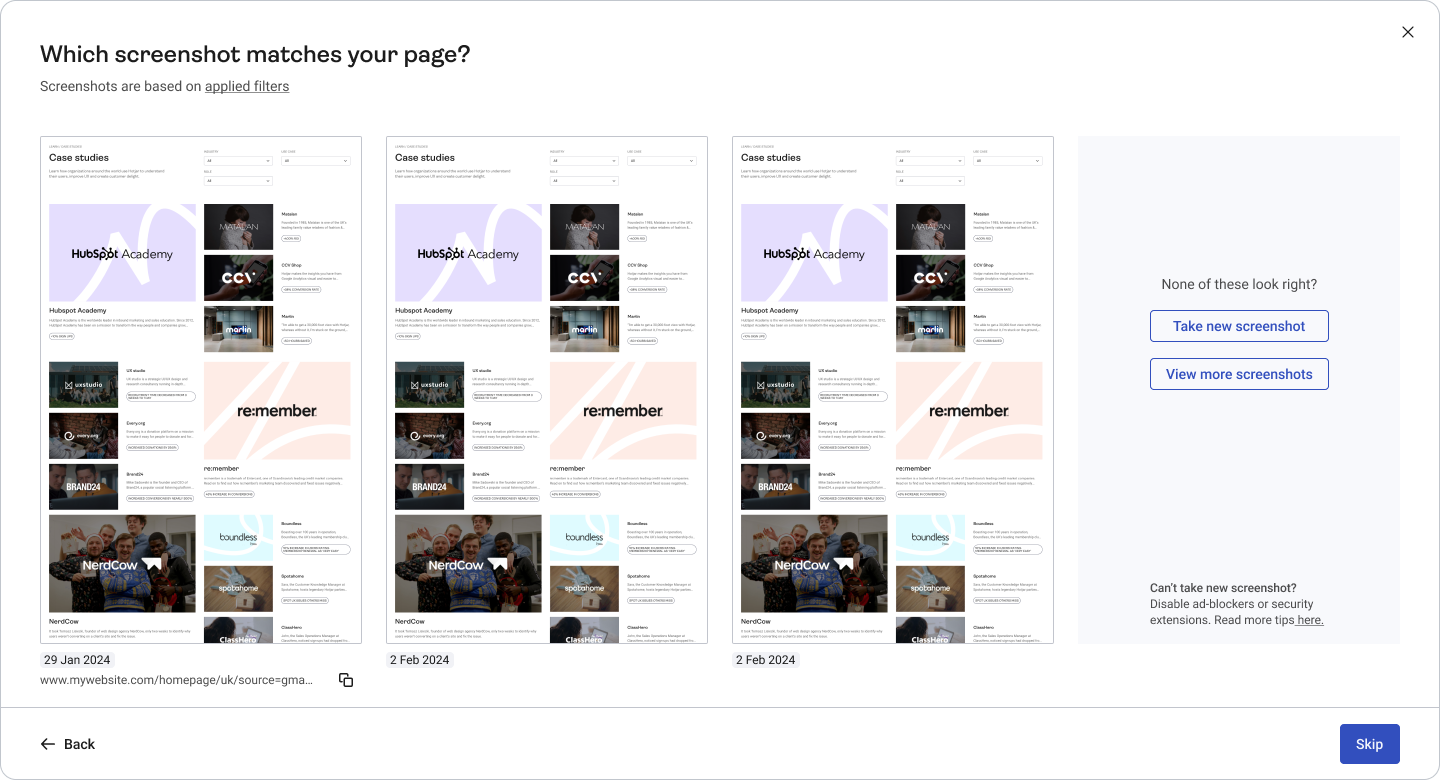
Previously, users could only assess and adjust the screenshot after generating the heatmap. We made this process more intuitive by introducing screenshot selection earlier in the flow. Based on the URL entered, users were shown a selection of auto-generated screenshots. If none were suitable, they could capture a new one manually. This change ensured that by the time users reached the heatmap report, they were seeing the correct and most relevant version of their page.
Together, these enhancements meant users not only started with the right map type for their goal but also saw more accurate, high-quality visualizations. As a result, they were more likely to explore other map types and return with different questions in mind.

The result:
We A/B tested the new heatmap creation flow, and within less than a month, saw the conversion rate increase from 82.19% to 83.14%—a relative lift of ~1.16%, resulting in approximately 1,100 additional conversions. Based on these results, we rolled out the new flow to all users.
The follow-up:
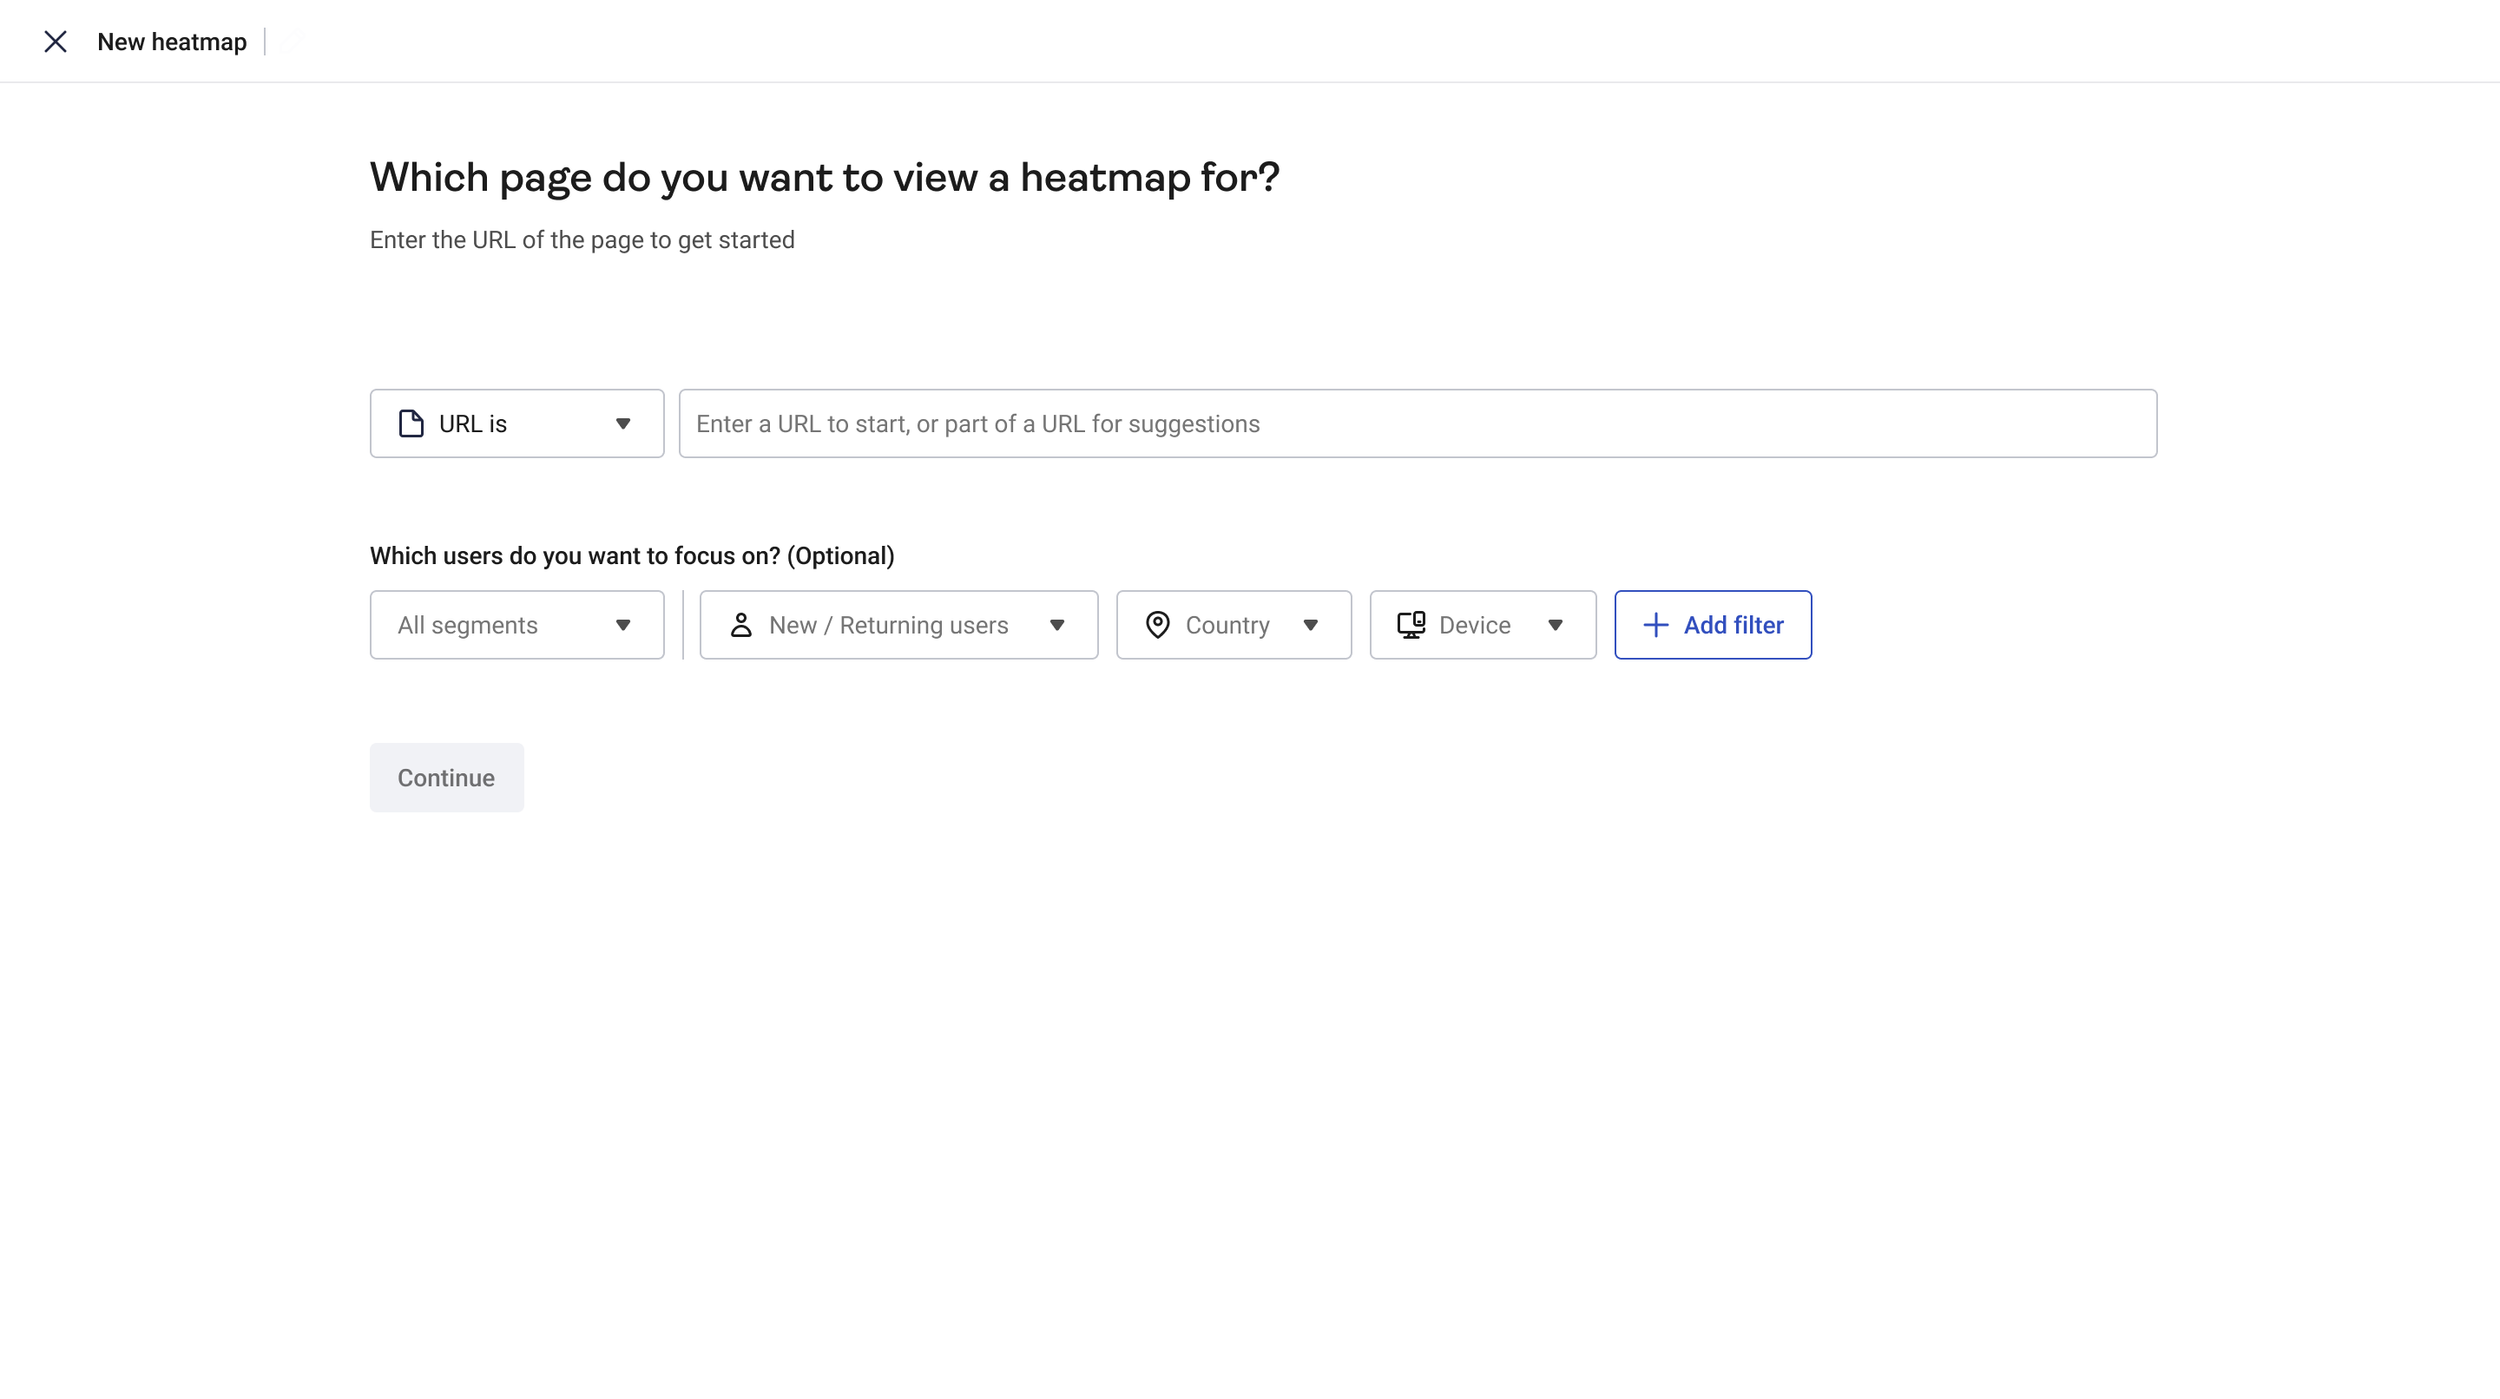
As a further enhancement, we introduced filtering options on the screen where users enter their page URL. This allowed them to define the user segment, time range, and behavior criteria before the heatmap was generated—boosting both visibility and usage of filters.
We also made the device picker more prominent, enabling users to fully customize their heatmap before it was even created. As part of this iteration, I explored and designed different ways of presenting filters, including a more content-led approach I developed during a vision workshop our squad hosted.
Phase 3 (Contentsquare): Bringing Heatmaps and Zoning together
Designing an experience that leads with simplicity but allows for depth
Following Contentsquare’s acquistion of Hotjar, we started merging some of the platforms’ products. I was part of the team responsible for bringing Hotjar’s Heatmaps to Contentsquare’s Zoning.
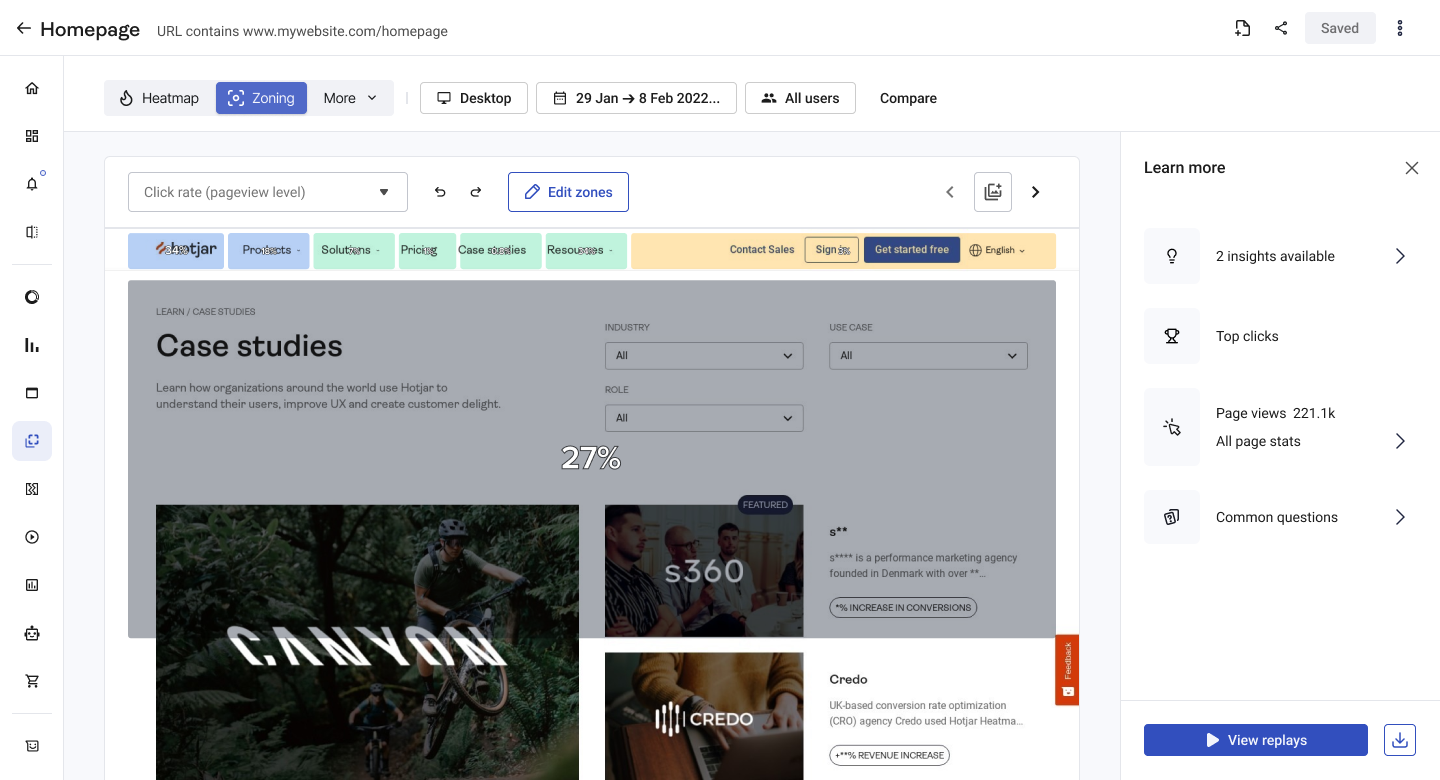
Heatmaps allow users to get a high level overview of a page’s performance, whereas Zoning allows for more advanced capabilities where users can analyze any zone within a page.
Our objectives were:
Unify Heatmaps and Zoning in a seamless way for a smooth upsell flow. The idea being that only customers on higher plans would have access to Zoning.
Simplify the Contentsquare experience by introducing the Hotjar guided approach. Dealing with complexity was one of the biggest challenges and simplification was a wider company objective. We knew that ease of use accelarates retention.
Create an experience that caters to customers on any plan, of any size (SMBs, Mid-market, Enterprise). Prioritize the core job-to-be-done (JTBD)—understanding user behavior on the page—while still allowing users to dive deeper when needed.
Engage beginners and enable experts to complete more advanced tasks.

Summary of jobs to be done we identified for the different segments, depending on their plan
The process:
We started by comparing the two current experiences - Zoning in Contentsquare, and Heatmaps in Hotjar. We discovered some key issues we wanted to address while bringing the two together:
Map types confusion: Research has shown us that some Hotjar customers struggled to understand the difference between map types (e.g. Click, Scroll, etc.) and Overlays (e.g. Top 3 clicks). We also knew that certain map types weren’t delivering enough perceived value.
Information overload: Another issue customers highlighted was the overwhelming amount of information crammed into the heatmap’s two side panels, which significantly reduced the analysis area. This clutter also made key actions, such as switching device types, less visible.
Confusing information architecture: In Contentsquare, similar actions, like creating and deleting zones, were separated, while unrelated actions were grouped together.
Alignment and simplification of terminology: in Contentsquare, customers struggled to understand certain terms. For example, they didn’t know what the difference between AB test analysis and page analysis is. I also established we called similar things by different names across the two platforms, e.g. ‘‘screenshots’’ in one and ‘‘snapshots’’ in the other.

Comparison between Hotjar’s Heatmap creation flow (on the left) and Contentsquare’s Zoning one (on the right)
We had a lot to do and limited time to release the first iteration of the unified experience. I was also working with an entirely new team—the Product designer, PM, and Engineering team were from Contentsquare, I was one of the few Hotjar alumni.
I identified key issues and, in collaboration with the designer and PM, prioritized the tasks we could realistically complete for the first release.
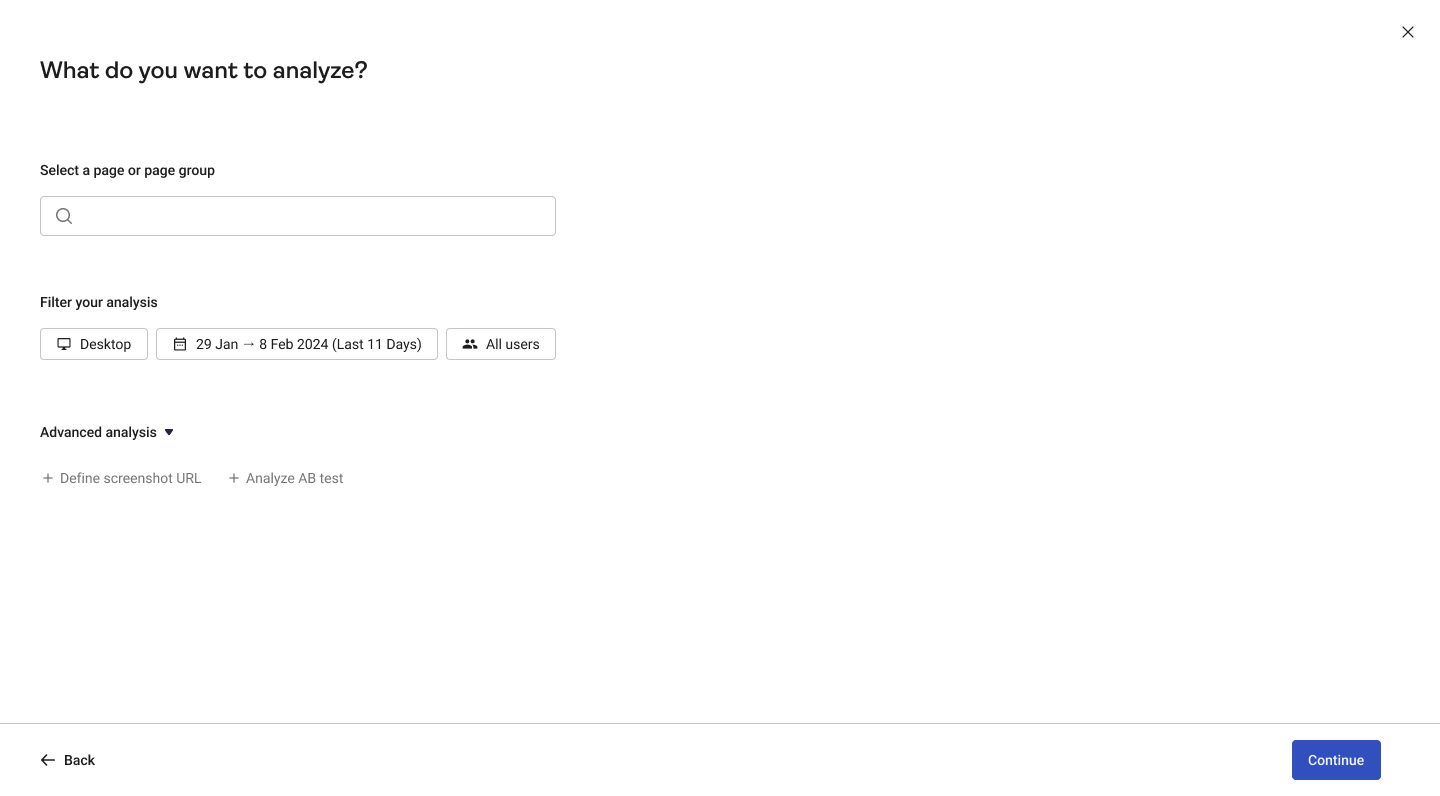
We introduced to Contentsquare the guided creation flow I had previously worked on in Hotjar. Of course, it wasn’t a case of copy-paste. We had to incorpoirate certain Contentsquare capabilities into it…
Set up flow changes:
Support experts
We prioritized surfacing the most important information at a glance, while making secondary details (e.g. screenshot date and URL) easily accessible through progressive disclosure patterns—such as hover states, accordions, and steppers.

Heatmaps/Zoning analysis changes:
Less distractions:
Other Contentsquare analysis modes (e.g. Table mode, Merchandise) are hidden under the "More’’ tab. This way the UI is less crowded and customers can immediately access the most common analysis modes—Zoning and Heatmaps.
Clarifying concepts:
Changed ‘‘snapshots’’ to ‘‘screenshots’’ following validation at usability testing.
‘‘Modify snapshot’’ is renamed to ‘‘Capture interactive elements’’ to communicate the purpose of the feature in a clearer way.
The research:
The flow you’ve just read about, and all the terminology changes, were continuously validated via usability research. First, I started by conducting some internal interviews with the Support and Customer success teams, specifically the ones responsible for Zoning and Heatmaps. They told us some of the biggest pain points reported by customers.
After designing the initial version of the setup flow, we tested it with a selected group of Contentsquare and Hotjar customers. What made this particularly interesting was that for both groups, the flow included familiar and new elements. Hotjar users were unfamiliar with Zoning, while Contentsquare users had not encountered different Heatmap types before. This contrast provided especially valuable insights—not only about the UI but also about how different user groups perceive the value these tools offer.

Snippet of the research report detailing our findings
Terminology testing:
As mentioned earlier, we renamed and redesigned the concept of ‘‘modifying a snapshot’’ to ‘‘capturing interactive elements’’. This is an important part of the heatmap creation flow as it allows users to take a screenshot of a page containing an interactive element such as a pop-up, dropdown, modal. At Hotjar we referred to this as ‘‘View pop-ups and dropdowns’’.
During the internal interviews we conducted, we heard that both Hotjar and Contentsquare customers are struggling to understand this concept and how it works. This presented a great opportunity for improvement within the scope of this major project. However, due to other urgent priorities, the Product Designer and I had to limit the complexity of the changes we could implement.
We introduced a guide in the form of a side panel, triggered from two separate places whithin the screenshot selection. I kept the side panel simple, highligting the two ways in which users can capture interactive elements, and when to use each:

We ran an unmoderated preference test where we presented 13 particiapants with three variations of the ‘‘interactive elements’’ concept, shown within the screenshot selector screen. 9 out of those 13 participants chose ‘‘Interactive elements guide’’ as the clearest wording for the button that opened the side panel in the image above. The other two options were: ‘‘Pop-ups and dropdowns guide’’ and ‘‘Guide to menus and modals’’.
This was a great example of content-led design thinking, even when the team is quite restricted in terms of improvements we could make.
Allow for depth
AB test and other optional fitlers are moved under Advanced analysis, enabling experienced users to access more detailed analytical tools.
Engage beginners
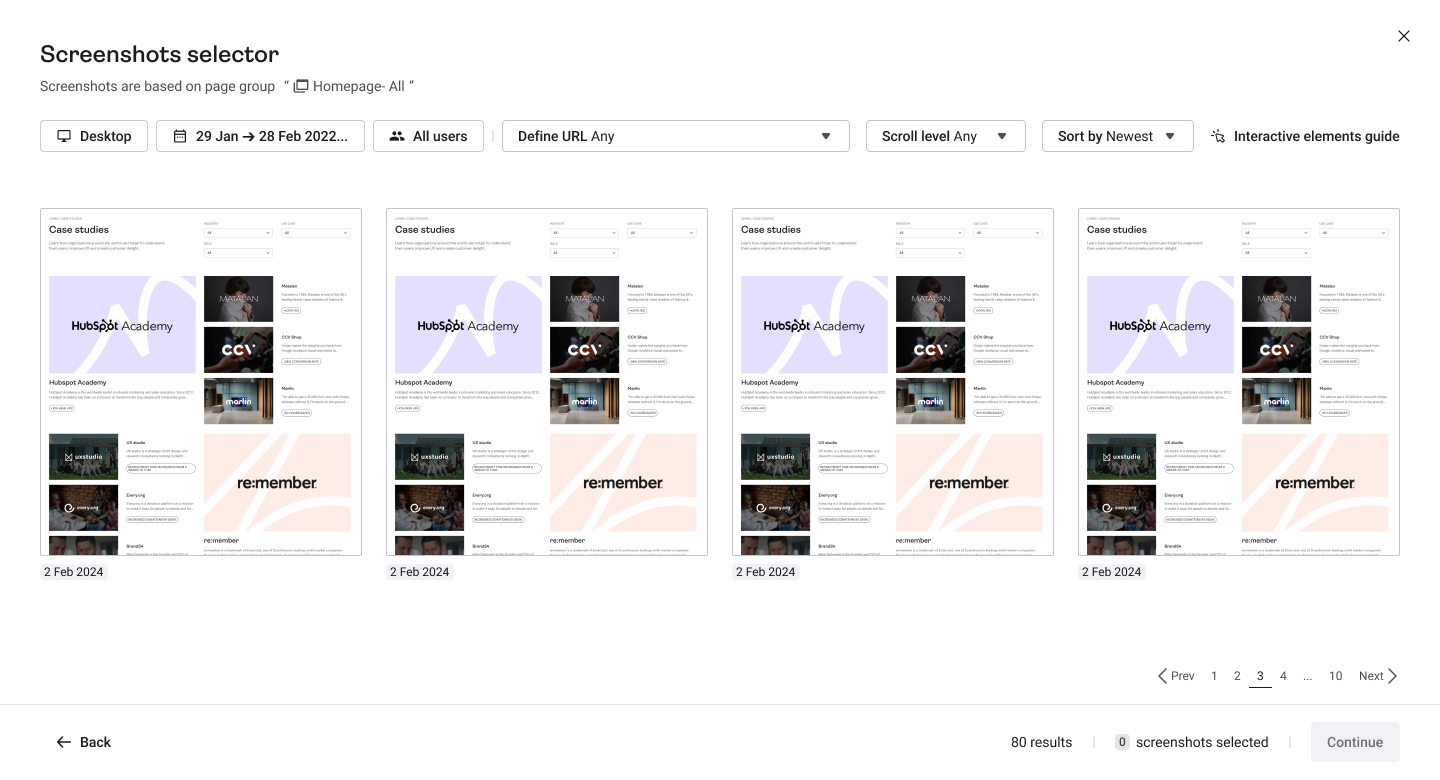
Additionl screenshot options (available in Contentsquare) are moved to a separate journey, accessible via the ‘‘View more screenshots’’ CTA.

Simplified insights:
We stripped down and simplified the side panel from Hotjar’s Heatmaps so it still offers additional insights but without overpowering the analysis area. It’s persistent as users move through the different analisis modes.
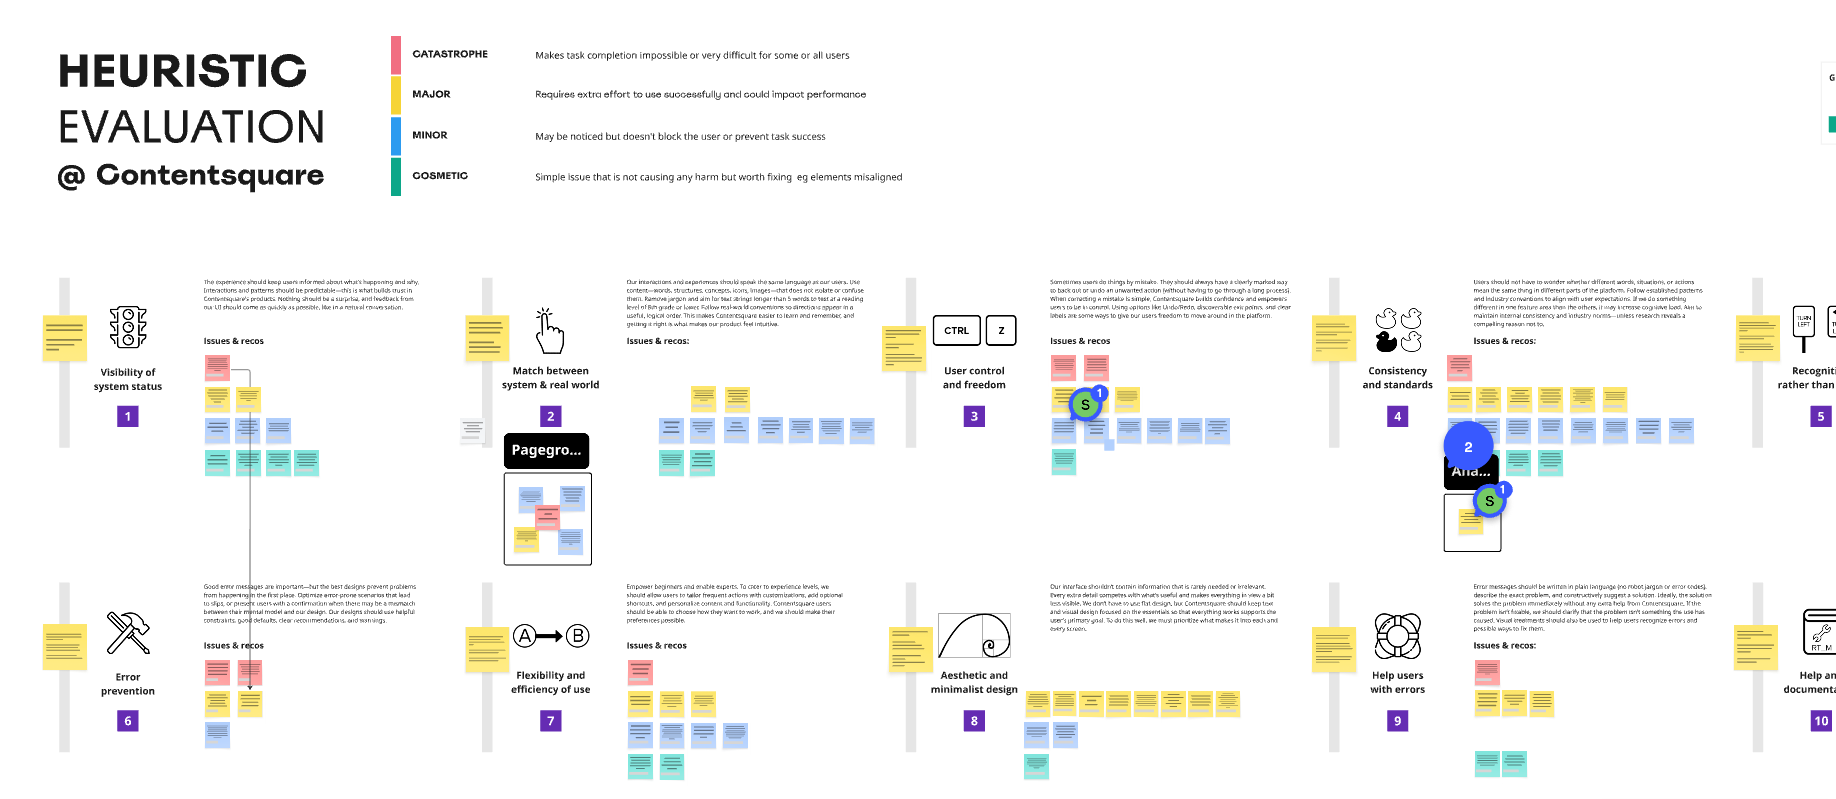
Heuristic evaluation:
Alongside all of this work, we conducted a heuristic evaluation of the Zoning experience which was a great exercise in brigning different teams together and putting our user hats on. We reviewed the main Zoning creation flow by completing a series of tasks, identifying and categorizing pain points and blockers based on their severity.
This helped us focus on the most pressing usability issues within Zoning, and provided a clear benchmark to guide further design improvements.
The result:
The improvements that we made tripled Heatmaps usage (from 10% to 30%), and boosted weekly active users of Zoning and Heatmaps by 3 percentage points—translating to thousands more engaged users each week.
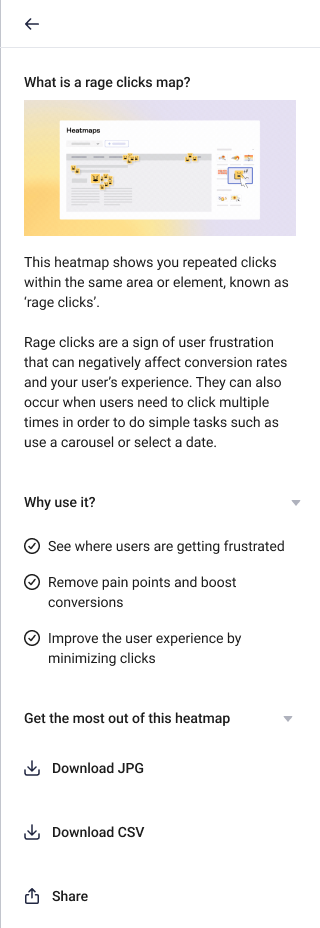
Rage click heatmap
Following the release of Engagement Zones and the positive results we saw from the educational element in the side panel, we decided to apply the same pattern to a new heatmap type we were developing: the Rage click map.
This map type was inspired by the same research mentioned earlier and was designed to help customers quickly identify weak points in their user experience at the click of a button.
To refine the concept, the Product Designer and I launched a survey to determine which rage icon resonated most with users. Since the term 'rage click' was already established elsewhere in the product, we chose to reuse it for consistency.